
HK-G10 - February 17th, 2006
Test HK-G10
February 17/06
- Unrestricted air (ashbox door open)
- Repeat of test G-07 / HK-G07
|
|
Test HK-G10
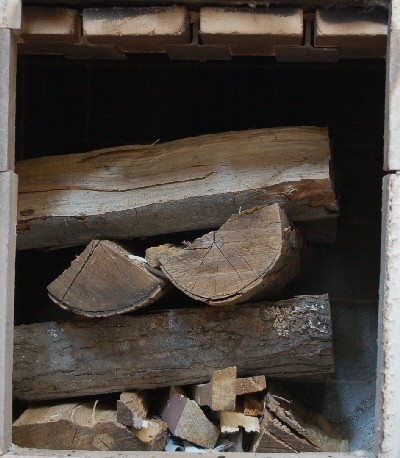
54.8 lbs
Ashbox door open
Grate was opened at 70 minutes.
Repeat run of test G-07
Excel Data File: test2006-g10.xls |
|
|
|
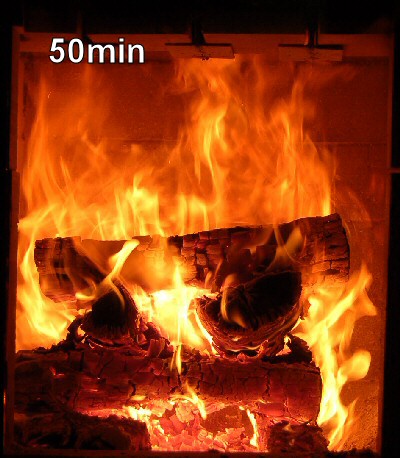
The animation shows a frame every 30 seconds of the burn for the first twenty minutes.
After that, it shows a frame every 5 minutes, so is speeded up by a factor of 10 until the end.
The animation loads frame by frame, and then starts repeating at a frame rate of 2 fps. |
|
|
|
Opacity peak at 2 minutes |
|
|
|
Then a dip. |
|
|
|
Then a second peak.
Test HK-G07 exhibited the same behavior (see bottom of this page for a comparison of the graphs) |
|
|
|
||
|
|
At 4.5 minutes, there is a rapid drop in opacity.
Note also the very steep slope of the temperature graph at just after this point. |
|
|
|
The kindling is pretty much burned up, at which point the burn slows a little. | |
|
|
There is a smaller spike in the opacity right after the kindling is used up. |
|
|
|
Reducing the air supply has an obvious and immediate effect on the exit temperature. |
|
|
|
||
|
|
After the pile collapses, the fire picks up. |
|
|
|
A small local temperature peak follows the opening of the rear grate.
Maximum closure for the grate is 90%, so there is always a small amount of air introduced at the back. |
|
|
Test HK-G07 |
Test HK-G10 Comparison with test HK-G07 |


No Comments