
Condar Dilution Tunnel Testing - 2008
Introduction
For a description of the current test heater setup in our lab, see 2006 - 2007 Heater Testing at Shawville.
See Alaska Condar Tests for background information on the Condar dilution tunnel. We have one of the 4 Condars calibrated in Alaska installed here at our lab in Quebec.
Tests in series
- HK-J01
- HK-J02
- HK-J03
- HK-J04
- HK-J05
- HK-J06
- HK-J07
- HK-J08
- HK-J09
- HK-J10
- HK-J11
- HK-J12
- HK-J13
- HK-J14
- HK-J15
- HK-J16
- HK-J17
- HK-J18
- HK-J19
- HK-J20
- HK-J21
- HK-J22
- HK-J23
- HK-J24
- HK-J25
- HK-J26
- HK-J27
- HK-J28
- HK-J29
- HK-J30
Condar Setup

The Condar samples vertically through a nozzle into the top of the last flue liner. After consulting with Paul Tiegs at OMNI, we have modified the nozzle to extend it to the centre of the flue. The top half of the Condar is sitting on the bench. It holds the filters.
The used filters from a test are sitting to the right of the Condar:
- The main filter is black with a light coating of soot.
- The backup filter is clean, with a very small amount of tar (slightly yellow).
The Condar is powered by a vacuum hose, coming in through the wall behind the analytical balance.

The Magnehelic gauge at the top reads the flow through the Condar sampler nozzle. This is kept constant at 0.4 cfm. As the filters plug up, the vacuum is boosted to maintain constant flow. The vacuum motor speed is manually controlled with the Variac control directly below the Magnehelic.

The mixing barrel (dilution tunnel) portion of the Condar. The calibrated 3/8" hole at the center is the sample nozzle, which extends to the centerline of the flue. The smaller holes draw in a fixed ratio of dilution air. This cools and dilutes the smoke, similar to what happens in the atmosphere, and allows the semi-volatiles to condense into tar droplets so that they can be collected on a filter. If the gases were hot, some of the semi-volatiles would blow through the filter uncondensed, and deposit less particulate.
To the right of the Condar is the probe for the Testo 330-2 flue gas analyzer.
To the top right is the light source for the opacity reading.

A CdS sensor is mounted on the breadboard and aimed at the light through the opening in the flue. The metal tape covers up the damper slot.
Computer monitor - screen capture
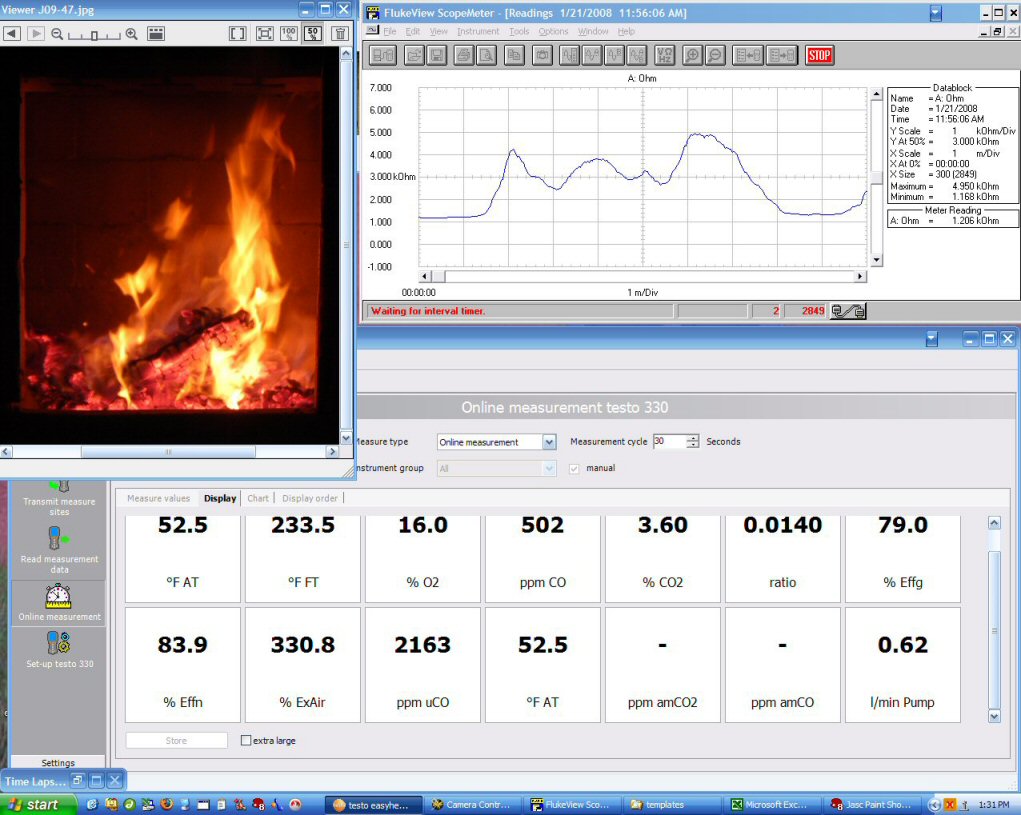
Graph at top right is the opacity measurement.
Photo window shows the most recent photo in the time lapse series.
Bottom window is the data display from the Testo flue gas analyzer.

No Comments