
HK-G00 to HK-G08 - February 1st, 2006 to February 13th, 2006
Feb 01/06 - Preliminary Test
This test was a dry run.
- The heater was not preheated.
- Test fuel was cold (brought in from outside)

Fuel was not weighed, it was approximately 1/2 a load (35 lbs).
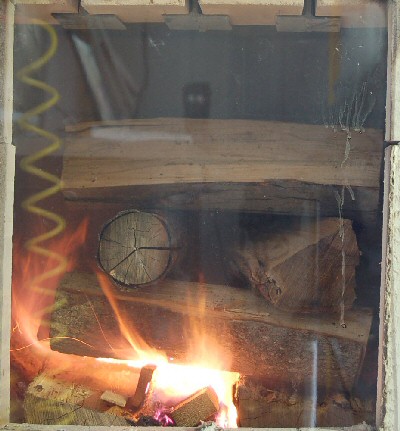
Fuel load stacked in firebox.

Graph of stack temperature and light extinction.

Photo taken at the opacity peak at 5 minutes.

Photo taken 3 minutes later, when the opacity reading was near zero.
Stack temperature is low.
Steam can be seen condensing as it exits the chimney.
This has to be distinguished from smoke, and makes visual assessment more complicated.
Comments
The light extinction in the test section of flue seems to be a good predictor of visible smoke from the chimney.
Past particulate matter (PM-10) testing experience at Lopez (see PDF) indicates that visible smoke is a very good predictor of grams per kilogram particulate emissions.
PDF: p-awma2.PDF
At this point, no calibration of the CdS sensor has been done, so the next step is to determine whether we are in the linear range of the sensor's light response.
Further results
February 6/06
Paul Tiegs, principal at OMNI-Test, has commented that opacity testing was tried in the 1980's with conventional woodstoves, and did not find strong correlation with particulates.
Paul adds that EPA has a standard method, (U.S. EPA Method 9), that requires readings to be made at various distances downstream of the chimney exit, depending on the dissipation of moisture particles. There is another test method that is in-stack, but requires the gas stream to be higher than 350F or so, so that volatile organics remain uncondensed.
In view of Paul's comments, we have done elementary testing of the CdS sensor for linearity, but decided to concentrate first on determining if this method as a whole is useful for the particular case of masonry heaters.
Since we are measuring at the chimney entry, we do not appear to be getting water condensation in the flue stream, but can't be certain at this point. This requires some further investigation. Since we are mainly investigating the cold start, it takes some time before gas temperatures reach 350F.

This is a view through the ceramic glass end cap on the horizontal flue, illuminated by a flashlight beam, during combustion.
The far end (left side) downdraft channel is clearly visible. Small particles of ash caught in the flashlight beam provide a good visualization of the gas path and speed (not visible from the photograph).
The thermocouple/draft probe is inserted through the damper frame and visible.
February 8/06 - Tests G-02 + G-03 / HK-G02 + HK-G03
We have conducted 2 more burns (G02 and G03). Both times, there were some glitches with the CdS sensor setup, which should be resolved for the next test.
You can view a 5 Mb animation of test G-03 below. It shows the startup at 30 second intervals for the first 20 minutes, and 5 minute intervals for another 40 minutes or so. Note: the flames appear redder in the photos than they do to the eye. Fuel load was 62 lbs.

The Excel data for G03 (Feb 8) is posted below.
Download Excel Data: test2006-g03.xls
February 10/06 - Test G-04 / HK-G04
Here's a 4Mb animation of test G-04, with less air. Fuel load was 55 lbs. All runs are with 8 pieces of fuel.

February 11/06 - Test G-05 / HK-G05

56.8 lbs
Ashbox door left open during the burn (more air)
Excel Data File: test2006-g05.xls
February 11/06 - Test G-06 / HK-G06

54.3 lbs
Ashbox door closed, with air control open (less air than above).
Excel Data File: test2006-g06.xls
February 12/06 - Test G-07 / HK-G07
|
|
Test HK-G07 Feb 12/06 52.3 lbs
Ashbox door left open during the burn (more air). Compare with test HK-G08 (less air). Ashbox door was closed at 45 minutes (reduced air). At 70 minutes, the fire was poked and the grate air was opened.
Download Excel Data: test2006-g07.xls |
|
|
|
This burn was interesting. The kindling was somewhat tight, so the startup was slow.
This frame is at 60 seconds, when we see the first opacity spike on the graph. |
The animation shows a frame every 30 seconds of the burn for the first twenty minutes.
After that, it shows a frame every 5 minutes, so is speeded up by a factor of 10 until the end.
The animation loads frame by frame, and then starts repeating at a frame rate of 4 fps. |
|
|
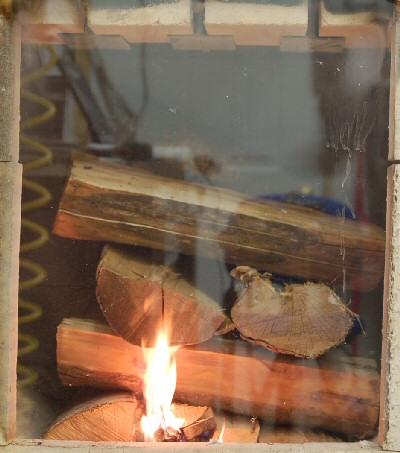
This frame is at 2:30 minutes.
Opacity has reduced. |
The Nikon D50 camera is set on auto exposure.
Reflections are visible in the glass due to the long exposure.
This only happens at the startup.
A manual exposure setting that is suitable for the whole burn would probably be preferable. |
|
|
Opacity curve is at the dip in between the first two peaks on the graph. | |
|
|
The fire has just started to take off.
This is the second opacity peak visible on the graph, and is the point of maximum opacity in the burn.
Smoke is evident in the firebox.
Note the steep temperature rise and opacity decline right after this point. |
|
|
|
Fire is burning brightly, and wood pile is starting to have a lot of space between the pieces.
The ashbox door is closed, which reduces the air supply.
|
Digital cameras are more sensitive to the infrared spectrum.
This results in a photo that looks redder than the real fire looks to the eye.
We will experiment with the camera white balance setting to try and get a more realistic representation.
Only rough calibration has been done so far on the laser and CdS photoresistor detector.
A 0.3 neutral density filter gave the same opacity reading as in this frame. This represent a light reduction of 1 stop (50%). |
|
|
The graph shows a clear dip in the exhaust temperature, and a small spike in the opacity |
|
|
|
The pile collapses at 1 minute after this photo. | |
|
|
This photo is after the pile collapse, with reduced air.
This corresponds with the last opacity peak in the graph, after which the opacity remains at zero. |
Stack temperature at this point is 476F.
The opacity would seem to be from non-volatile particulates.
|
|
|
||
|
|
Just after this photo, the remaining wood was poked towards the grate at the rear, and the grate air was openened.
No change in opacity. |
|
|
|


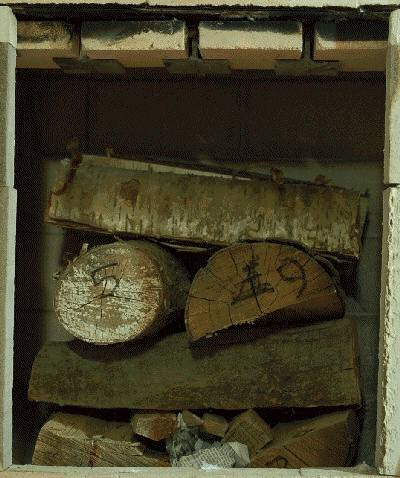
Fuel Load for G-07


Pieces are numbered 1 - 8, from left to right. They maintain their numbering during stacking, so the fuel pile geometry can be characterized. Each piece is weighed separately and the circumference and length are measured. The spreadsheet is programmed to add up the piece weights and calculate the surface/volume ratio of the fuel pile.
February 13/06 - Test G-08 / HK-G08
Compare with test HK-G07, yesterday:
G-08: - less air
G-07 - more air
|
|
Test HK-G08
52.6 lbs
Ashbox door closed with air supply open (less air than test G07, yesterday)
Grate was opened at 70 minutes. Fire was poked to the rear grate at 85 minutes.
Excel Data File: test2006-g08.xls |
|
|
|
30 seconds.
The outside insulated chimney was downdrafting cold air, and required a torch to reverse the draft prior to startup.
This resulted in a particularly slow start. |
The animation shows a frame every 30 seconds of the burn for the first twenty minutes.
After that, it shows a frame every 5 minutes, so is speeded up by a factor of 10 until the end.
The animation loads frame by frame, and then starts repeating at a frame rate of 4 fps. |
|
|
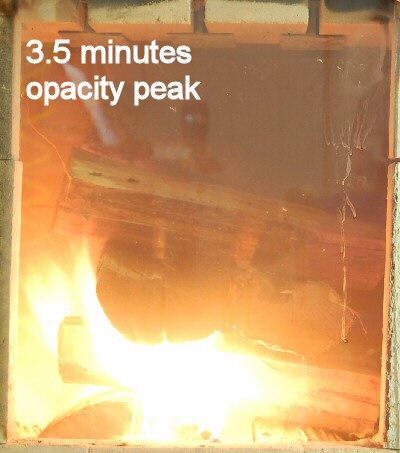
3.5 minutes
Stack temperature is only 120F There is a large opacity spike.
Particulate emissions are limited by the fact that there is very low flow in the chimney at this point. |
|
|
|
Things are finally starting to catch.
The main pile catches, there is a sharp increase in the slope of the flue temperature graph. |
|
|
|
|
|
|
|
|
|
|
|
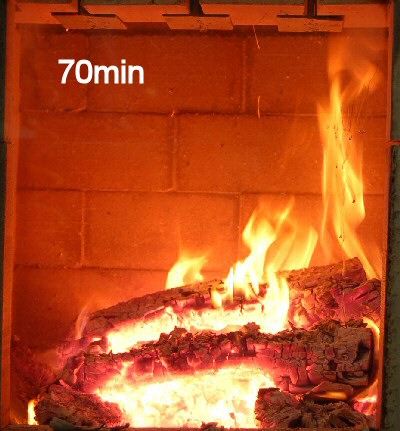
The grate air was opened at 70 minutes.
This burned up the fuel over the grate at the back of the firebox, and left a bare spot over the grate after 10 minutes.
The exit temperature started to go down.
At 85 minutes, the remaining wood and coal is piled on top of the grate. |
|


Temperature graphs for the oven back and right side heater surface about 65" from the floor. With the ashbox door open, the heater runs with a higher exit temperature, and a lower oven temperature.
Fuel Load for G-08

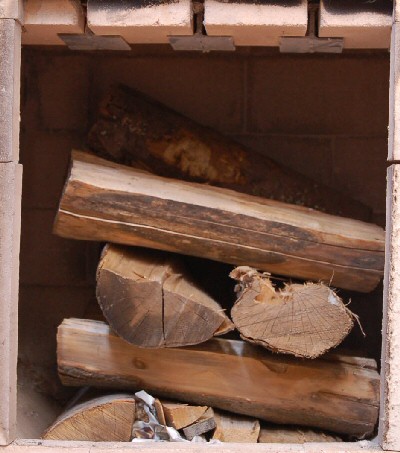
- Pieces are numbered 1 - 8, from left to right.
- They maintain their numbering during stacking, so the fuel pile geometry can be characterized.
- Each piece is weighed separately and the circumference and length are measured.
- The spreadsheet is programmed to add up the piece weights and calculate the surface/volume ratio of the fuel pile.
No Comments